Request a Quote
Share your product list, technical ratings, quantity and delivery destination.
Read transformer turns ratios correctly, account for winding connections and taps, and check the test report before accepting equipment.
Transformer turns ratio compares the number of turns in two windings. For an ideal transformer, it equals the voltage ratio across those windings. A three-phase nameplate usually specifies line-to-line voltages, so the winding connection must be accounted for before comparing a calculated ratio with a test result. Start with the nameplate, connection diagram and tap position, then check how the test report defines its ratio.
For two windings sharing the same alternating magnetic flux, the ideal relationship is:
NH / NL = EH / EL
N is the number of turns; E is the induced winding voltage. H and L identify the high- and low-voltage windings. Keep that direction consistent: a 20:1 high-to-low ratio is 0.05:1 when reversed. The OpenStax transformer equations explain the ideal voltage-to-turns relationship.
Suppose an ideal single-phase transformer has 1,000 turns on one winding and 50 on the other. Its ratio is 20:1. With 400 V across the first winding, the corresponding ideal voltage is 20 V.
Use ratio to check voltage conversion and winding configuration. Keep load capability, losses and temperature rise as separate specification items. Two offers with the same ratio can still have different kVA ratings and operating performance.
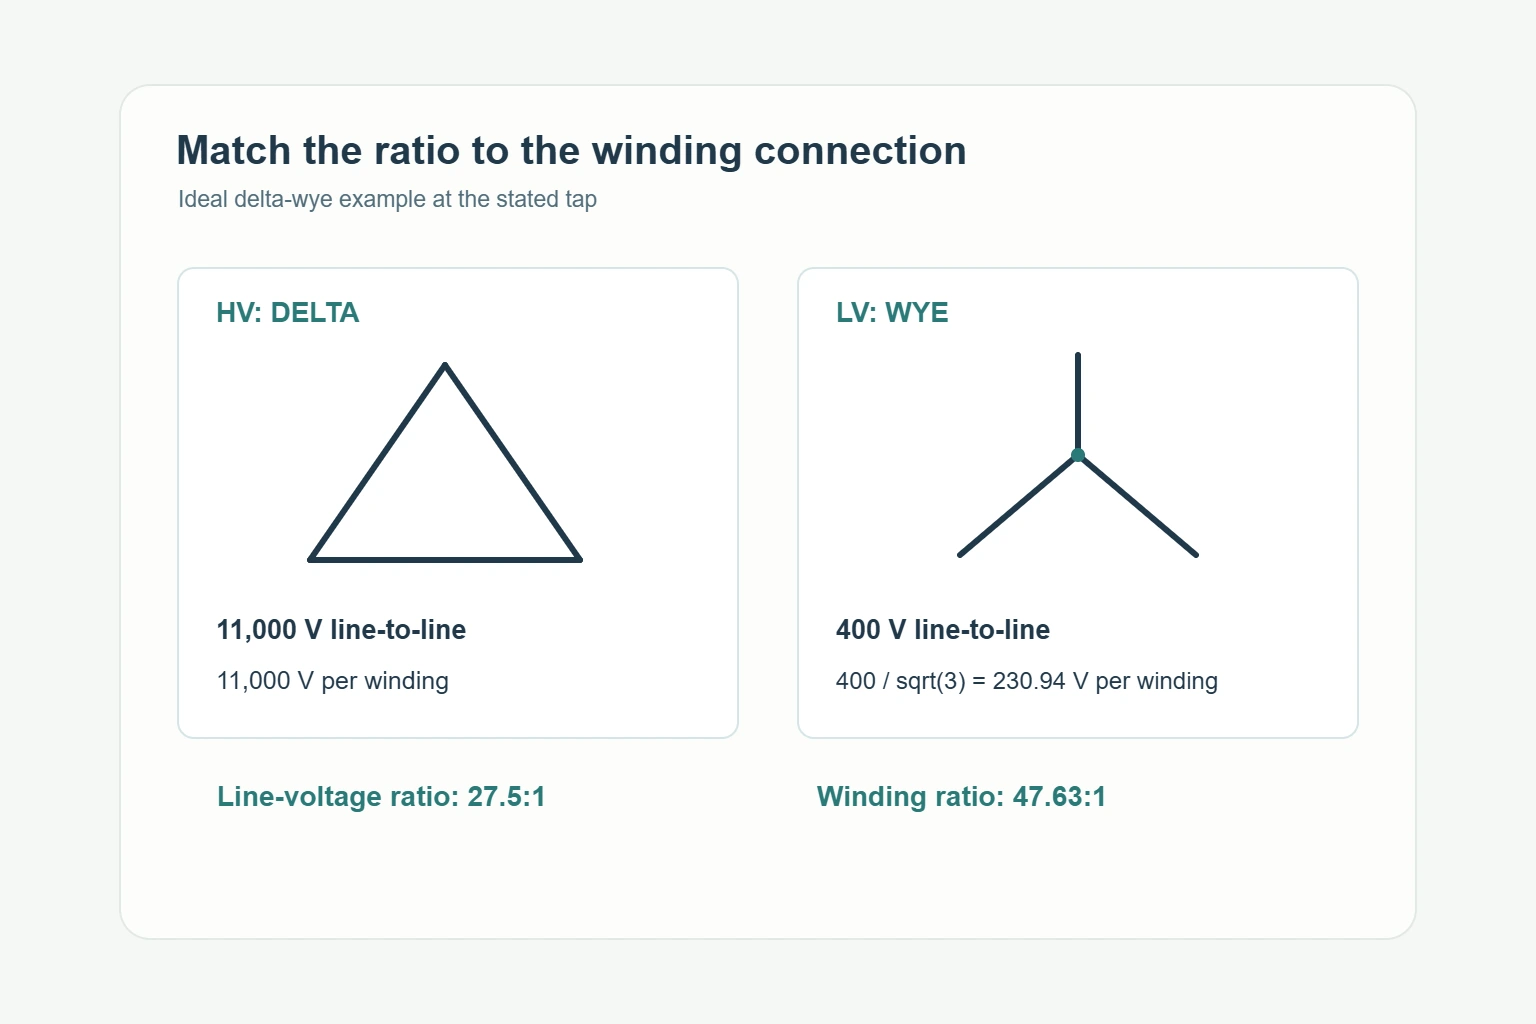
For a balanced three-phase system, a delta-connected winding has the line-to-line voltage across each winding. A wye-connected winding has line-to-line voltage divided by √3 across each winding. This changes the relationship between the nameplate voltage ratio and the physical turns ratio. MIT’s power-systems notes derive these relationships in Chapter 3, sections 4–6.
| HV / LV connection | Turns ratio NH/NL, using line-to-line voltages |
|---|---|
| Wye / wye | VH / VL |
| Delta / delta | VH / VL |
| Delta / wye | √3 × VH / VL |
| Wye / delta | VH / (√3 × VL) |
Consider an ideal 11,000 V / 400 V delta-wye transformer, with both ratings expressed line-to-line. The line-voltage ratio is 27.5:1. Each LV winding has 400/√3 ≈ 230.94 V across it, giving a winding turns ratio of approximately 47.63:1.
Both numbers describe the same assumed transformer. Before flagging a discrepancy, ask whether the report shows a connection-corrected winding ratio or a terminal-voltage ratio. Confirm the software setting and terminal pairing rather than applying a correction twice.
A ratio magnitude does not describe the complete phase relationship. For a three-phase transformer, compare the specified vector group, the nameplate diagram and the recorded phase relationship. For single-phase units, check the terminal polarity identification and the relevant test result.
The distinction matters when a unit must match an existing installation. Put the required connection and terminal identification into the purchase specification, then require the supplier to demonstrate that the delivered unit matches them. Do not approve a substitution solely because the nominal voltages agree.
Modern instruments can report these checks separately. For example, the DV Power TRT Standard series measures ratio, phase shift and excitation current and includes vector-group detection. Check which functions were actually used in the supplied report.
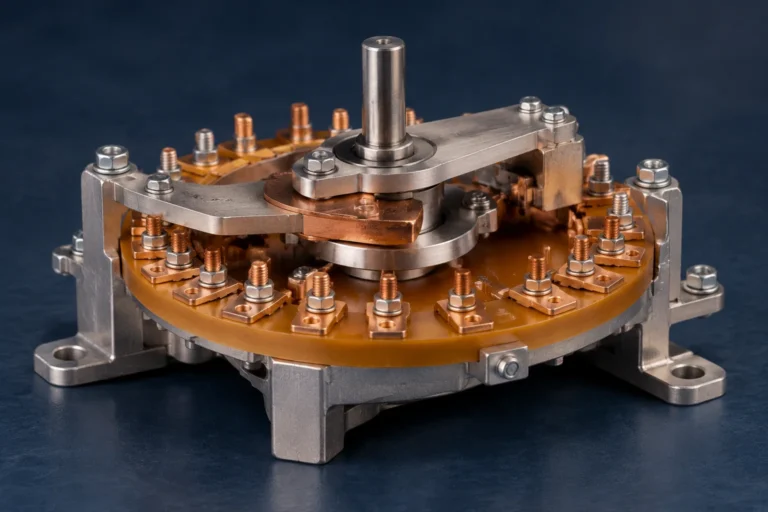
A tap schedule gives more than one voltage relationship. The report needs to identify the tap position for each measurement, the applicable rated voltages and the calculated target ratio. A principal-tap result alone leaves the other specified positions unchecked.
For an assumed HV tap rated 10,725 V with a 400 V LV winding, the rated line-voltage ratio is 26.8125:1. Comparing it with the 11,000/400 principal-tap ratio of 27.5:1 would produce an apparent −2.5% difference before any measurement error is involved. Apply the winding-connection conversion consistently to both values.
Match the report’s tap labels to the approved tap schedule. If the drawing uses position numbers and the report uses percentages, resolve that mapping before acceptance. Keep the delivery tap setting in the handover record so commissioning personnel can compare it with the project requirement.
Ask for the underlying results, not just a pass stamp. PowerDB’s transformer report forms show how nameplate information, tap positions, test voltage, ratio, phase angle and instrument details can be recorded together. The following checklist adds the procurement information needed to interpret those results.
| Report field | What the buyer should verify |
|---|---|
| Unit identity | Manufacturer, model, serial number and purchase-order reference match the delivered equipment. |
| Rating and connection | Rated voltages, frequency, connection diagram and vector group match the approved documents. |
| Tap and terminals | Each result identifies its tap position and measured phase or terminal pair. |
| Ratio definition | High-to-low or low-to-high direction; winding ratio or terminal-voltage ratio; connection correction used. |
| Expected and measured values | Target ratio, measured ratio and reported deviation are available for review. |
| Test conditions | Test voltage, frequency and test mode are recorded where needed to reproduce the comparison. |
| Instrument traceability | Instrument model, serial number, calibration information, date and operator are identifiable. |
| Acceptance decision | The applicable specification or standard edition and clause, limit and disposition of exceptions are stated. |
Using a signed-deviation convention:
Deviation (%) = (measured ratio − expected ratio) / expected ratio × 100
For an expected ratio of 20.000 and a measured ratio of 20.030, the calculated deviation is +0.15%. Confirm whether the reporting software uses this sign convention or displays an absolute value. The arithmetic gives the deviation; the agreed acceptance criterion determines the decision.
Set that criterion before the purchase order is finalized. Ask which transformer specification, standard edition and clause apply, and how the requirement treats the relevant taps and connections. A default limit printed on a software template should not silently become the contract requirement.
Keep the detailed report with the approved drawing revision. If a supplier submits a spreadsheet, request the original instrument export or signed report as well, so rounding, copied formulas and renamed tap positions can be checked. If two report revisions disagree, ask which measurement was repeated and why. Retain the correction history with the final acceptance record instead of replacing the earlier result without an explanation.
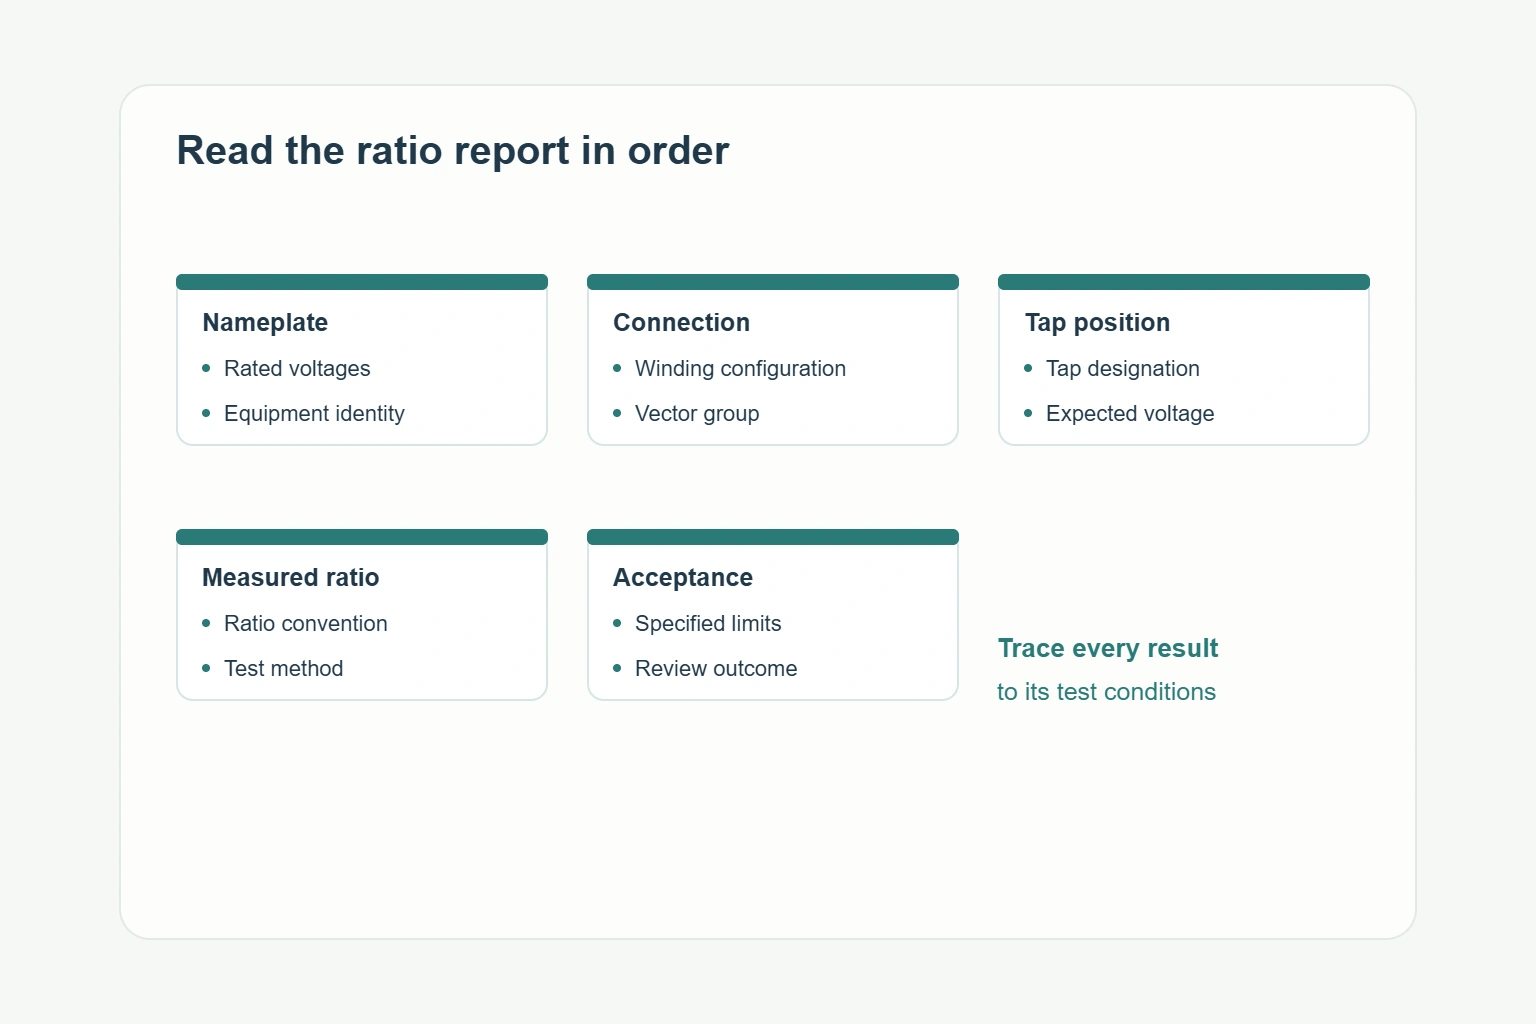
Work through the report in a fixed order:
Describe the pattern precisely when raising a query: one phase at one tap, one phase across several taps, or the same offset throughout the report. Send the affected rows and your recalculation to the test provider. Ask whether the cause is an input, connection, measurement or equipment issue, and what evidence closes it. A written response tied to those rows is more useful than a general statement that the transformer passed.
Keep excitation-current comparisons on a consistent basis. DV Power’s testing FAQ explains that excitation current changes with test voltage and that results from sequential and simultaneous three-phase methods cannot be compared directly. Ask for comparable conditions when assessing repeat measurements.
If retesting is needed, have qualified personnel follow the approved procedure with the transformer isolated from its power system.
For ideal single-phase windings, the voltage ratio equals the turns ratio. On a three-phase nameplate, check the line-to-line voltage ratings and winding connections. Delta-wye and wye-delta connections introduce a √3 factor.
Yes. Use the rated voltages for the selected tap and keep the connection conversion consistent. Comparing a nonprincipal tap with the principal-tap target can create an apparent error.
Use the limit in the agreed transformer specification and applicable standard edition and clause. Confirm its scope for the connections and taps being assessed before approving the report.
Verify unit identity, tap position, ratio direction, voltage basis and connection settings. Recalculate the expected value, identify the affected phases and taps, and ask the test provider to document the discrepancy and resolution.
When comparing transformer options, send the supplier the required HV/LV voltages, frequency, phase arrangement, vector group, tap range and tap steps. Add the existing connection diagram when the new unit must match installed equipment.
Request a sample report format during quotation and a serial-number-specific report with the delivery documentation. State the required phase and tap coverage, ratio definition and acceptance reference. This makes competing offers easier to compare and prevents a short test summary from concealing missing results.
Submit the nameplate requirements and drawings with your RFQ, and ask the supplier to confirm the proposed connection, tap schedule and test-report deliverables in its offer.