Request a Quote
Share your product list, technical ratings, quantity and delivery destination.
Compare transformer losses, reference temperatures and efficiency conditions. Use a worked bid example and load-profile assumptions to assess energy costs.
Compare transformer losses on the same electrical and test basis before comparing efficiency percentages. Ask each bidder for no-load loss, load loss at stated current and reference temperature, the efficiency calculation conditions, and the documents supporting those figures. Then apply one project load profile and one cost model to every offer.
A transformer with lower no-load loss can have higher load loss. Its advantage therefore depends on how long it remains energized and how heavily it operates. A useful bid comparison preserves those two loss figures separately.[3]
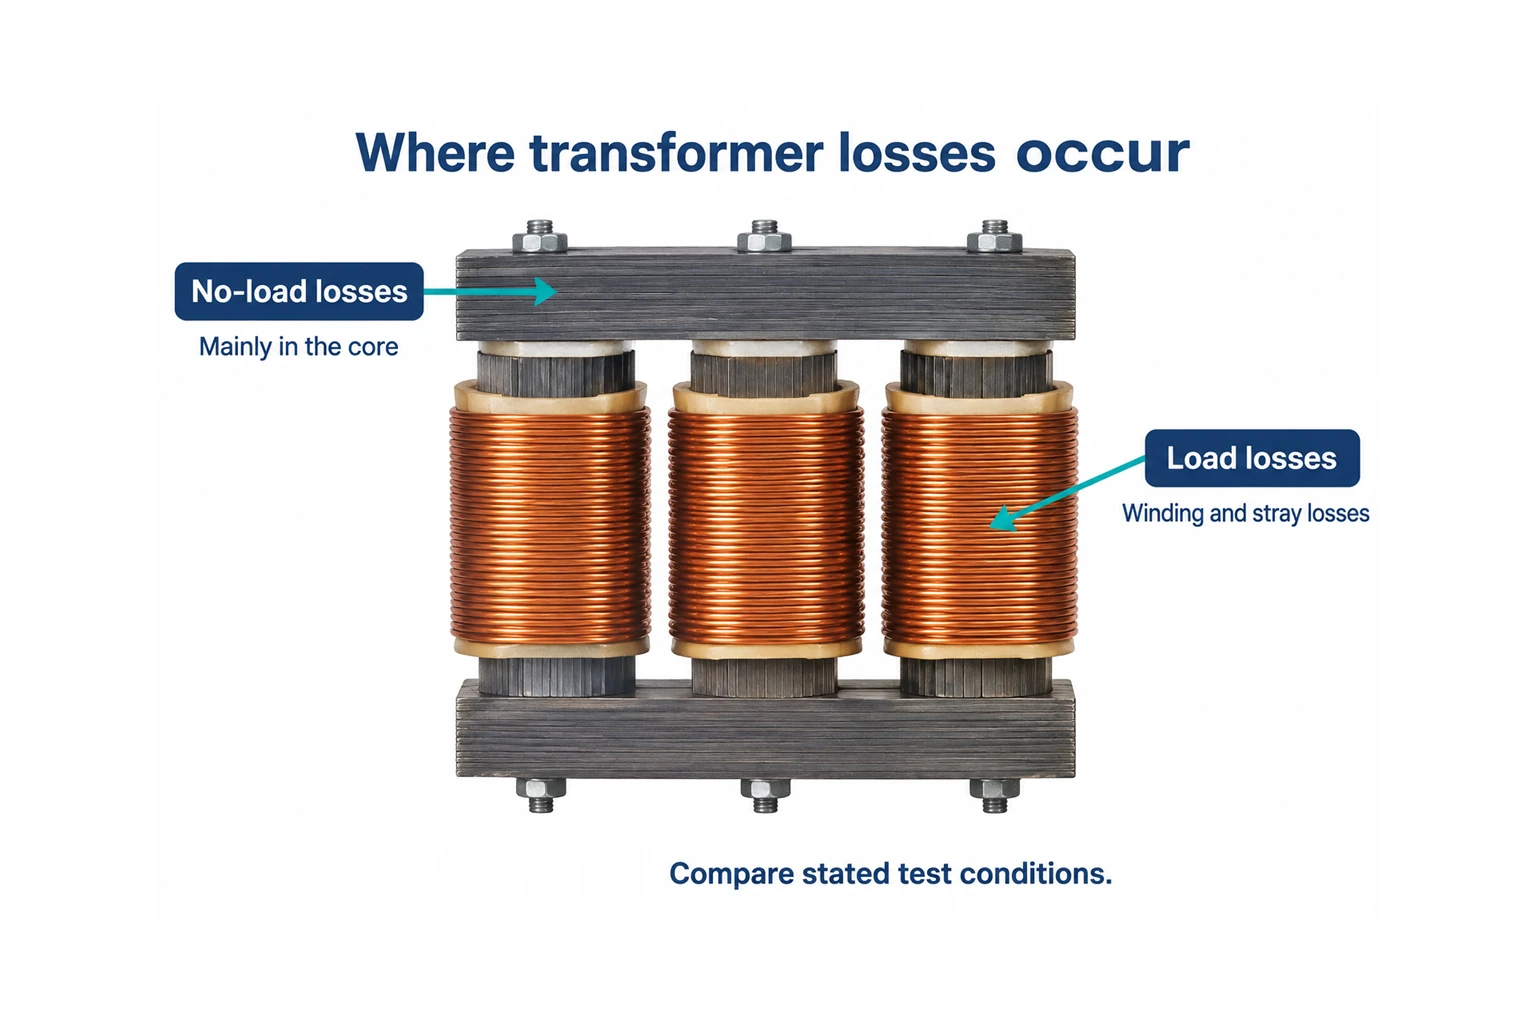
No-load loss occurs while the transformer is energized, even when it supplies no useful load. It arises mainly in the magnetic core, including hysteresis and eddy-current effects. For a screening calculation at fixed voltage and frequency, it is commonly treated as a constant term.[1][3]
Load loss increases with current. It includes resistive loss in the windings and additional losses associated with leakage flux in conducting parts. Calling all of this “copper loss” can obscure what a supplier has actually reported, particularly where the windings use aluminum.[1][2]
Ask for the report’s definitions and units. A value in watts describes power loss at a stated condition; annual lost energy is measured in kilowatt-hours and requires an operating schedule.
If the proposed arrangement includes fans, pumps or other powered accessories, request their consumption and operating schedule separately. Agree whether they are included in the comparison boundary. Otherwise, two bids can use different definitions of total operating energy without making that difference visible.
Use a common data sheet rather than copying each supplier’s headline efficiency into a spreadsheet. The following fields make differences easier to investigate.
| Comparison field | Information to request | Why it affects the decision |
|---|---|---|
| Offered configuration | Model, kVA, voltage ratio, phase, frequency and cooling arrangement | Establishes which equipment the figures describe |
| No-load loss | Watts, test voltage and frequency, correction basis | Defines the energized baseline |
| Load loss | Watts, current or load fraction, reference temperature and tap | Defines the variable loss term |
| Efficiency | Load fraction, output power factor and included losses | Makes the percentage reproducible |
| Loss evidence | Guaranteed or indicative values, test method and report reference | Separates a bid commitment from a catalogue example |
| Operating profile | Energized hours and hours at each load level | Converts loss power into annual energy |
| Cost assumptions | Energy price, evaluation period and discount basis | Makes the financial comparison auditable |
| Acceptance | Agreed tolerances, required tests and treatment of deviations | Gives both parties a common review basis |
Expand the equipment description with the transformer specification checklist. Keep the loss schedule attached to that same configuration, including any revised winding, voltage or cooling proposal.
Two load-loss values reported at different reference temperatures are not directly comparable. The DOE test method, for example, separates ohmic and stray losses because their temperature dependence differs. Ask the supplier to provide values corrected under the applicable method and identify that method’s reference temperature.[2]
Do not apply one resistance multiplier to an unexplained total-load-loss figure. Request the underlying components or a corrected report. A temperature-rise designation and a loss reference temperature also serve different purposes; record them in separate fields.
For an initial comparison, total transformer loss can be approximated as:
Total loss ≈ P₀ + x² × Pₖ
Here, P₀ is no-load loss, Pₖ is load loss at rated current, and x is the operating current divided by rated current. At approximately constant voltage, x also represents the fraction of rated apparent power. Use the same units for both loss terms.[3]
This model holds the loss-temperature basis and electrical conditions fixed. It is a screening estimate. Actual winding temperature, harmonics and other operating differences can change the result. Harmonic currents can substantially increase winding and eddy-current losses, so significant nonlinear loads need a separate application review.[2][4]
If the project load itself is uncertain, resolve that input with the transformer sizing guide before assigning a precise annual savings figure.
Assume two 500 kVA offers with the same voltage, frequency and comparison temperature. Their hypothetical loss schedules are below. These figures are invented solely to demonstrate the calculation; they are not HJD product data or regulatory test results.
| Loss quantity | Bid A | Bid B |
|---|---|---|
| No-load loss, P₀ | 0.600 kW | 0.900 kW |
| Load loss at rated current, Pₖ | 5.000 kW | 3.500 kW |
| Estimated total loss at 25% load | 0.913 kW | 1.119 kW |
| Estimated total loss at 75% load | 3.413 kW | 2.869 kW |
For Bid A at 25% load, the unrounded result is 0.600 + 0.25² × 5.000 = 0.9125 kW. At 75%, it becomes 3.4125 kW. Bid B has lower estimated total loss at the higher operating point, despite its higher no-load loss.
The comparison image uses rounded totals from this hypothetical example.

The next question is how many hours the installation spends at each load level. Neither row alone describes annual operating cost.
Efficiency is useful output power divided by total input power.[5] For the same simplified calculation boundary:
Efficiency = output kW ÷ (output kW + total loss kW) × 100%
At 75% of 500 kVA and an assumed output power factor of 0.90, useful output is 337.5 kW. Using the unrounded losses above gives approximately 99.00% for Bid A and 99.16% for Bid B.
Those percentages describe that operating point. Change the load fraction, power factor or loss basis and the calculation changes. A percentage without those inputs gives a buyer little basis for reconstructing the comparison. Keep the original watt figures available alongside the percentage, especially when rounding hides small differences.
For each operating interval, multiply estimated total loss in kW by the hours at that load. Add the interval energies. Use energized hours for the no-load term, including periods when the transformer is energized without supplying useful output.
Continue the hypothetical example with 4,380 hours at 25% load and 4,380 hours at 75%. Assume fixed comparison losses, no auxiliary consumption, and no outages or seasonal changes. The calculation gives 18,943.5 kWh per year for Bid A and 17,465.25 kWh for Bid B, a difference of 1,478.25 kWh.
At an assumed energy price of USD 0.12/kWh, that difference is about USD 177 per year. The tariff is an illustrative input, not a quoted electricity price. Demand charges, cooling costs and other financial effects are excluded.
Do not replace this schedule with a single 50% average load and expect the same answer. Squaring each load fraction before weighting the hours gives a different result from squaring the average load.
A lifecycle comparison also needs the purchase and installation costs, evaluation period, energy-price assumptions and discount rate. DOE’s economic analysis treats equipment costs, operating costs, discounting and equipment lifetime as separate inputs.[3]
Use the same assumptions for every bid and test a lower-load and a higher-load scenario. If a utility supplies loss-capitalization factors, use its stated definitions and units. Avoid adding a second estimate of the same energy cost after it has already been capitalized. The transformer cost guide covers other quotation differences that should remain visible.
For a U.S. project, first check the offered equipment against the distribution-transformer definition and exclusions in 10 CFR 431.192. Then identify the applicable category and table in 431.196. A product name or a “DOE 2016” label does not complete that check.[5][6]
DOE published its amended final rule on April 22, 2024, with a rule effective date of July 8, 2024. The amended standards apply to covered equipment manufactured in, or imported into, the United States starting April 23, 2029.[3] The eCFR text reviewed on November 14, 2026, displayed current through November 12, 2026, retains separate manufacturing-date provisions before and from that transition.[6]
DOE also published a request for information on June 15, 2026.[7] Recheck the applicable text when reviewing the order. The example calculations here establish no compliance conclusion for an offered model.
Send the same load schedule and comparison sheet to each bidder. Request the identified configuration, loss schedule, test basis and supporting report references together. Use the transformer testing guide to frame the document review and agree how discrepancies will be resolved before order acceptance.
For an HJD enquiry, send the project requirements and bid comparison inputs. Ask the team to confirm the proposed supply scope, configuration and available supporting documents before treating any loss figure as a firm offer.
No. An energized transformer still has no-load losses, mainly associated with the core. An unloaded operating period therefore belongs in the energy calculation. A de-energized period requires a different treatment.[1]
Not necessarily. Winding resistive loss is one component. The applicable test method may also include stray losses in windings and other conducting parts. Confirm the report’s definition before adding or comparing figures, so the same component is not counted twice.[2]
Only after checking the underlying load fraction, power factor, temperature basis and included losses. Request the separate no-load and load-loss values and reproduce the calculation at the project’s relevant operating points. The highest percentage at one point does not determine the lowest annual cost.[3][5]
No. Compare the load-loss term, energized hours, load profile and price premium as well. In the hypothetical example, Bid A has lower no-load loss, while Bid B has lower estimated annual loss under the stated schedule. A different schedule can change the ranking.